
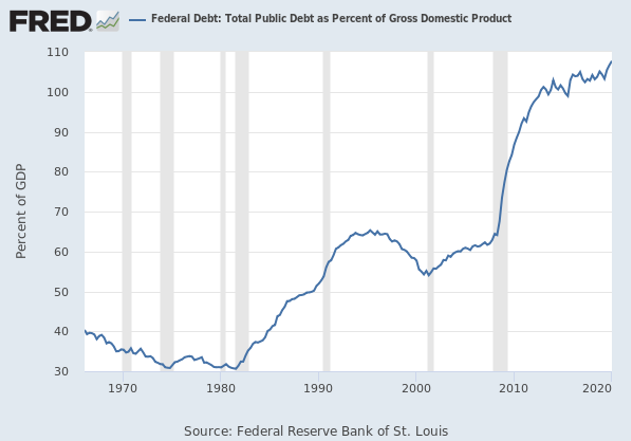
Mountains of Debt
This year, the U.S. federal government’s debt relative to gross domestic product (GDP) is expected to be at the highest level since World War II. This rise is due to the major fiscal response by the Administration and Congress to the COVID pandemic coupled with deficit spending trends in recent years. The Federal Reserve Bank of St. Louis projects this year’s level will be well over 100%. Only a handful of economies such as Greece, Italy and Japan have debt loads that exceed their economies. The last year U.S. debt exceeded GDP was in 1946, when it was at 106% after four years of war.
The novel coronavirus that swept the globe in early 2020 also compelled the Federal Reserve to intervene in an unprecedented fashion. Its aggressive and swift action calmed financial markets, which led to a rebound in many asset prices. The Fed lowered its main interest rate back to near zero in March. It has ramped up its bond buying programs – known as quantitative easing – to pull down long-term rates. Between mid-March and mid-June, the Fed’s portfolio of securities held outright grew from $3.9 trillion to $6.1 trillion. The Fed introduced multiple temporary lending and funding facilities to help institutions with borrowing needs. It has indicated its easy money policy, with low interest rates, will continue for the indefinite future.
These actions were a “break the glass” moment to avert a severe downturn. There never has been a descent of this speed, magnitude or severity. Collectively, these policies not only calmed the markets and kept credit flowing but also provided relief programs for large and small businesses to stay afloat. Although these actions were necessary, there are several implications for investors going forward.
After World War II, the U.S. brought its debt down quickly, thanks in part to rapid economic growth. Federal expenditures fell by more than half between 1945 and 1947. By 1949, falling federal expenditures and an economy growing at 4% per annum reduced the ratio of debt-to-GDP by more than half to less than 50%.
The post-World War II growth and reduction in debt will be difficult to replicate after the war on COVID is over. There does not appear to be any appetite in either of the two major parties to embrace fiscal restraint or reduce the overall debt level. The population is rapidly aging with the 65+ population anticipated to grow by 92% between now and 2060. Alternatively, the below age 18 population is expected only to grow 8%. In recent years, developed economies such as the U.S., Germany, United Kingdom have grown about 2% per year.
What are the implications of a lower growth and lower yield economy to investors going forward? If there is no “rising tide” that lifts all boats, individual stock and bond selection will take on new relevance. Fundamental analysis and research on companies will be important factors to differentiate good-from-bad operating models. Slower economic growth may increase battles for market share as companies rely increasingly on competitive share gains to achieve growth. The viability of a company’s competitive moat will increase as will the importance of management’s capital allocation decisions. Low cost debt may tempt companies to make acquisitions that are subpar and overpriced, which in the future may strain balance sheets.
Similar implications can apply to bonds, both taxable and non-taxable. The low cost of debt may encourage issuers to assume too much debt, reinforcing the merits of individual bond selection and research. Low yields that extend across maturities will provide little to no risk premium for those who hold longer term bonds.
At Delta, our active management approach is focused on long-term investing in companies with competitive moats, conservative balance sheets, positive cash flows and an acumen for capital allocation. Our fixed income investments are selected individually, emphasizing investment grade securities and reducing long-term exposure. We believe investors are most successful when they follow a sound discipline that avoids passively following momentum in either direction and, in turn, base their decisions on a rational, value-based approach.
September 30, 2020
Federal Reserve Bank of St. Louis and U.S. Office of Management and Budget, Federal Debt: Total Public Debt as Percent of Gross Domestic Product [GFDEGDQ188S], retrieved from FRED, Federal Reserve Bank of St. Louis; https://fred.stlouisfed.org/series/GFDEGDQ188S,
Company Comments
Comments follow regarding common stocks of interest to clients with stock portfolios managed by Delta Asset Management. This commentary is not a recommendation to purchase or sell but a summary of Delta’s review during the quarter.

The Procter & Gamble Company { PG }
Since its founding in 1837 by William Procter and James Gamble, P&G has grown to be the world’s largest consumer products company and one of the most profitable with over $70 billion in sales and $16 billion in operating profit. Procter & Gamble sells its products in more than 180 countries and territories. The company’s diversified portfolio of branded products includes major brands, such as Crest, Gillette, Pampers, Olay, Oral-B and Tide. P&G has built or acquired a portfolio of 21 brands, each of which generates between $1 billion and $10 billion in revenue each year. And the company has three times more billion-dollar brands than its next largest competitor and more than most of its remaining competitors combined.
P&G’s success has been built on a long-standing business model: discover meaningful consumer insights as to their needs and wants through deep consumer research and understanding, translate those insights into product innovation and create compelling marketing and advertising to convince consumers of the superior performance and value of P&G products. The company’s brands often hold top market share positions in their respective categories. Its sheer size confers economies-of-scale benefits in manufacturing and distribution, giving it a strong bargaining position versus its retailers.
P&G has completed a major five-year transformation that led to a 70% reduction in brands and $10 billion in cost savings. The company now is executing a new $10 billion savings program focused on reducing overhead costs and better cost efficiency in its manufacturing and distribution. As a result, P&G’s more focused portfolio consists of 10 product categories and 65 brands that still maintain unmatched broad consumer appeal and reach. The company has centered its portfolio on its strongest brands with large market positions and the best opportunities for both revenue and profit growth.
CEO David Taylor is pushing cost savings and efficiency, not as one-off events but as part of the company’s operating DNA. Management is focused on using its cost savings and improved cash flow to increase innovation and marketing spend on core brands to accelerate organic growth. This strategy and the resulting investments have been successful the past few years as evidenced by above market growth, market share gains and higher profitability. Pantry-stocking during the COVID-19 pandemic is giving P&G further momentum. Innovation and a disciplined emerging market expansion strategy will continue to be a driving force behind P&G’s long-term growth outlook.
P&G has significant market share and usually controls one of the top spots in most categories and segments in which it competes; however, the company does face strong competition from branded and store-brand offerings. These competitors have at times been especially aggressive in discounting and promotional activity. P&G realizes the need to defend its market share and has been more aggressive in its pricing adjustments and promotional activity in its major categories and geographic markets. Another potential risk is its exposure to rising commodity costs. If combined with lower shelf prices, rising commodity costs can cut significantly into margins.
Given P&G’s concentration in mature markets and increasing exposure to faster-growing developing markets, we believe the company can grow revenue at a low single-digit pace over the next decade. Given this rate of growth and continued productivity and efficiency improvements, we have assumed the company can generate operating margins of approximately 23% over our modeling period. Based on these assumptions, our stock valuation model indicates P&G’s current stock price offers a long-term average annual rate of return of approximately 5%.

Baxter International Inc. { BAX }
Baxter International provides a broad portfolio of essential renal and hospital products, including acute and chronic dialysis, IV solutions and administrative sets, infusion systems and devices, nutrition therapies, biosurgery products and inhaled anesthetics as well as pharmacy compounding, drug formulations and software and service technologies.
The company’s global footprint combined with the critical nature of its products and services play a key role in expanding access to healthcare in emerging markets and developed countries. Baxter is among the global market share leaders in all its businesses, with manufacturing in 20 countries and products and systems sold in 100 countries. The company’s manufacturing scale with worldwide distribution and product breadth in injectable and inhaled therapies make the firm a vital supplier to caregivers.
Baxter’s medical delivery and dialysis businesses comprise a diversified mix of both basic and innovative products. The company maintains large global market shares in mature but stable products, such as IV administered therapies, infusion systems and nutritional solutions. Baxter offers the broadest selection of pre-mixed drugs in the industry and continues to expand revenue from innovative drugs, such as inhaled anesthesia. Baxter’s renal division – its largest business – should continue to benefit from the strong dialysis market growth due to rising global rates of diabetes. The consumable and medically necessary nature of Baxter’s products provides relatively consistent revenue and operating cash flow.
Baxter has created a strategy centered on portfolio optimization, operational excellence and strategic capital allocation. The company’s plan to continue to drive sales growth and profit margin improvement includes management’s focus on the anticipated growth of several high margin businesses (biosurgery, nutrition, acute renal therapy and inhaled anesthesia), the launch of new, high margin products and services as well as exiting certain low margin businesses. The company also will continue to reduce its manufacturing footprint and capture additional supply chain efficiencies. Execution of this long-term strategy has led already to substantial profit improvement, and we expect further profit and free cash flow gains in the
years ahead.
Baxter’s innovation pipeline is robust with four new infusion pumps expected to launch this year, including a new platform that will contain options for large volume pumping, syringe administration and patient-controlled analgesia all in one pump, which will put Baxter more on par with its competitors.
Baxter’s main challenge is continuing efforts on cost containment in the healthcare industry in general that may exert pricing pressure on medical products. In addition to government regulation, managed care organizations’ purchasing power has strengthened due to their consolidation into fewer, larger organizations with a growing number of enrolled patients. Quality control is also a risk factor. Product recalls can harm relationship trust. Baxter also faces regulatory risk. Many of its products are subject to approval by the Food and Drug Administration (FDA) and regulatory agencies in other countries.
During the COVID pandemic, some of Baxter’s segments initially were negatively impacted by the dramatic decline of elective surgeries, particularly in April and May. The company has seen encouraging signs of improving surgical volumes and expects trends to improve in the second half of 2020. Underscoring the recovering outlook, the company announced an 11% dividend hike in May.
We believe Baxter can generate long-term revenue growth in the 3 to 4% range with cash flow margins over 22%. Based on these assumptions, our valuation model indicates Baxter’s current stock price offers a long-term average annualized rate of return of approximately 5%.
The Bank of New York Mellon Corporation { BK }
The Bank of New York Mellon, commonly known as BNY Mellon, is the world’s largest custodian bank by assets. It enables clients to create, trade, hold, manage, service, distribute
or restructure investments. BNY Mellon has over $3.5 trillion in assets under custody and $1.8 trillion in assets under management. The company has a vast global footprint delivering investment management and investment services in 35 countries. The global custody business is an oligopoly with six firms administering 75% of all financial assets. BNY Mellon is estimated to have roughly 20% of global market share in assets under custody.
BNY Mellon is uniquely positioned with a business model that is quite attractive in the banking industry. The bank provides a full spectrum of the investment process and the ability to provide sophisticated solutions to many of the most advanced and complex financial companies and investors globally. While others offer similar services, few other firms offer the scale or breadth of products necessary to service customers in this technology-driven business at a competitive cost. BNY Mellon is deeply involved in the operations of its clients. These strong relationships result in sticky customers – those who have loyalty to the brand – due to the high switching costs associated with back-office disruption that changing providers would entail. These competitive strengths have consistently delivered the highest profit margins and returns on tangible capital in the industry.
BNY Mellon’s largest business, Investment Services (75% of total company revenue and profitability), is the largest global custody bank with approximately 20% global market share. The bank tends to have the top market share in most of the servicing businesses in which it competes. Although it does face some cyclicality due to asset valuations, most revenues are recurring in nature with high switching costs. Historically, asset values have outpaced global GDP growth, and we expect continued growth in cross-border investment and capital flows along with expanding international market client relationships. BNY Mellon also should continue to benefit from changing regulations driving client demand for new solutions and services while encouraging many asset managers to outsource their back-office operations for greater security and oversight. Clients of custody banks tend to be exceedingly sticky as well, as they also are loath to risk the back-office disruption caused by switching providers.
Technology remains at the core of the company’s operations as the new CEO, Thomas Gibbons, considers the firm a software-as-a-service (SaaS) company at its core. Technology will continue to grow in importance in banking, particularly the types of services provided by BNY Mellon. The firm is seeing a payoff with faster execution, lower costs and faster time to market for new applications, which further strengthens client relationships. Going forward the firm remains at the forefront in utilizing new technologies to enhance the user experience, including cloud-enabled service platforms, developing business and client analytics, faster access to data and improved search capabilities as well as expanding mobile access for clients.
BNY Mellon’s revenue is 80% fee based, which is usually stable; however, there is still some cyclicality in the business as market swings do impact fees. A prolonged period of ultra-low interest rates will have a negative impact on revenue due to the potential for money market fee waivers and lower profitability on lending products. In addition, the bank’s business is built on its reputation as a qualified and trustworthy manager of risks and other sensitive operations, and any harm to its reputation could negatively affect revenues for an extended period.
Given the current level of assets under custody and management, we believe BNY Mellon will be able to grow revenue in the low single digits on increased services, modest market share gains and international market expansion. We expect the custody bank can generate return
on equity approaching 8.5% over the next decade. Based on these assumptions our financial model indicates that at the current stock price BNY Mellon’s stock offers a potential long-term annual return of approximately 13%.

United Parcel Service, Inc. { UPS }
UPS is the world’s largest package delivery company in an industry where network size matters, both in terms of customers and spreading costs over
a larger volume of packages. The company was founded in 1907 as a private messenger and delivery service in Seattle, WA. For calendar year 2019, UPS delivered 5.5 billion packages and documents, generating $74.1 billion in revenue.
The parcel industry enjoys favorable competitive dynamics. A start-up would find it difficult to replicate a competitive network of this scale. The barriers to entry are high as carriers own and/or lease large fleets of airplanes and trucks, trailers, terminals, sorting equipment, drop boxes, information technology systems and skilled labor. Despite its asset intensity and extensive unionization, UPS produces returns on invested capital about double its cost of capital and margins well above its competitors. This success is due to the firm’s investment in technology and operational efficiency.
Although there is intense rivalry between FedEx and UPS, pricing tends to be rational and price wars rare. UPS normally produces higher profit margins than its peers, due to its use of integrated assets to transport U.S. express and ground shipments through the same pickup and delivery network. In contrast, FedEx uses parallel networks of drivers and trucks to separately handle ground and express shipping. UPS clients have the convenience of using the same
driver to handle both express and ground packages, which yields greater operating efficiency
for UPS. The United States Post Office is both a competitor and partner, sometimes delivering
UPS packages the last leg of a shipment.
Over the past decade, UPS has expanded significantly the scope of its capabilities to include more than package delivery. Its logistics and distribution capabilities give companies the power to expand their businesses to new markets around the world. UPS provides shipping, logistics and return services for internet retailers, whose sales are growing three to four times faster than those of brick and mortar stores.
The parcel industry is a major beneficiary of internet sales trends. Throughout the world, online buying has grown exponentially. We expect e-commerce growth to continue at a high rate over the long term. Recently, the gains from internet sales have been tempered moderately by product digitization and miniaturization, which reduces average package volume and weight. Despite these trends, a broader selection of products is being purchased online as younger generations are more comfortable with cyber transactions.
The shift toward e-commerce has led to a structural increase in the capital required to meet ever-evolving customer demand. UPS invests $1 billion a year in information technology investments. Such a level of commitment is a material part of its 2019 $6 billion plus capital expenditure. This investment has paid off in efficiency and reduced costs. For ground delivery, UPS indicates its ORION route optimization system also has lowered costs by $400 million. New information technology projects target annual savings of $800 million to $1 billion within three to five years. UPS will need to add workers and infrastructure before creating sufficient volumes; consequently, costs likely will increase in the short term.
UPS has demonstrated high capital efficiency and strong cash flow generation throughout its history. The industry has benefited from three intertwined forces: the emergence of China,
the broad trend toward just-in-time inventory and the rise of internet commerce. The company should continue to benefit from volume growth from businesses shipping to consumers, an oligopolistic industry structure and growing global trade and supply chains. Based on these assumptions, our stock valuation model indicates a long-term average annual rate of return
of approximately 4%.
Wells Fargo & Company { WFC }
Wells Fargo is one of the largest community based, diversified financial services companies in the U.S., with nearly $2 trillion in assets. The bank offers a full range of consumer banking, commercial banking and investment banking services. Founded in 1852 and headquartered in San Francisco, it is consistently one of the top deposit gatherers in the country. The Wells Fargo model delivers a vast product set through a scaled domestic office and technology infrastructure with disciplined risk management.
Wells Fargo is largely a conventional lender. The bank’s $1.4 trillion plus deposit base and near dominant market position in fast growing markets are its biggest advantages. The bank consistently has paid less for balance sheet funding than most of its competitors over the last decade. It also is able to generate more revenue per dollar of assets than most peers. This low-cost funding has continued through the bank’s recent challenges to its reputation. Account closures did not spike during the worst of the sales problems, underscoring customers’ willingness to stick with the bank.
The company has a leading position in the mortgage market. It benefits from economies of scale in both origination and servicing as well as a scaled technology platform. An additional strength is the diversification of revenue relying on more stable revenue generated by its brokerage, advisory and asset management businesses. Unlike its major competitors, Wells
is not a major player in the cyclical investment banking and capital markets businesses.
Wells Fargo has more than 250,000 employees, and the firm’s practices currently are being examined with a fine-toothed comb by regulators and external auditors. In February 2018, the bank entered into an agreement with the Federal Reserve to freeze asset growth beyond $2 trillion until certain tests and requirements are met. Until these issues are fully resolved, management is unlikely to have full flexibility in capital allocation to optimally deploy shareholder capital. The economic impact related to the shutdowns and restrictions due to COVID-19 looms largest in the short-term.
We feel the bank can rectify its issues and has undertaken multiple steps to restore customer trust. The bank hired Charles Scharf as Chief Executive Officer almost a year ago to help improve its reputation and get businesses back on track. Scharf has prioritized resolving outstanding regulatory issues, changed the banks reporting structure, hired many new managers and committed to cost-cutting to the tune of approximately $10 billion in annual costs.
Wells boasts strong market share positions in many of the largest, fastest-growing and wealthiest markets in the country. This geographic strategy should help the bank grow organically faster than the banking industry on average once regulatory issues are resolved.
In addition, Wells Fargo’s balance sheet strength historically has allowed it to gain market share from banks needing to reduce assets and raise liquidity. Over time, we believe the bank’s net interest margin will expand as interest rates rise and the lending environment stabilizes.
We anticipate the company’s efficiency ratio will improve over the intermediate term as the company benefits from a declining regulatory burden, cost-cutting, a somewhat smaller branch network and annual non-interest income growth. We have assumed Wells will continue to maintain excess capital and liquidity above the required norm. Based on our assumptions, our financial model indicates that at the present stock price, Wells Fargo’s stock offers a potential long-term annual return of 16%.
Dated: September 30, 2020
Specific securities were included for illustrative purposes based upon a summary of our review during the most recent quarter. Individual portfolios will vary in their holdings over time in relation to others. Information on other individual holdings is available upon request. The information contained herein has been obtained from sources believed to be reliable but cannot be guaranteed for accuracy. The opinions expressed are subject to change from time to time and do not constitute a recommendation to purchase or sell any security nor to engage in any particular investment strategy. Any projections are hypothetical in nature, do not reflect actual investment results and are not a guarantee of future results and are based upon certain assumptions subject to change as well as market conditions. Actual results may also vary to a material degree due to external factors beyond the scope and control of the projections and assumptions.